

If there’s one financial statement that can take the gloss off an accounting magician’s sleight of hand, it’s the cash flow statement. Numbers on a profit-and-loss report can sometimes play in the realm of make-believe, but cash? That’s real. You either have it, or you don’t… and that simple truth makes cash flow the ultimate truth-teller when it comes to understanding how a business truly runs. Yet, too often, investors spend more time squinting at earnings reports than paying attention to the lifeblood of any company, its ability to generate actual cash.
This blog post zooms in on one crucial element of the cash flow statement. Don’t worry if terms like "non-cash adjustments" or "working capital changes" make your eyes glaze over. Think of it as peeling back the layers of an onion (minus the tears, hopefully) to reveal whether reported profits are backed by hard, spendable cash, or just accounting smoke and mirrors.
Like Charlie Munger might say, cash flow reveals "what really works, not just what flatters the ego of a bad accountant." By the end of this, you’ll not only understand the mechanics of CFO but also be able to spot the red flags that can save you from bad investments and sleepless nights.
💡 Quick note before we dive in:
This is the 4th and final post in the series. I’ve kept every part of this guide open and free, no locked PDFs, no paywalls.
If you’ve found this series useful and want to support my work, you can contribute whatever amount you feel is fair.
👉 Support my work — via UPI, card, or wallet.
Cash Flows from Operating Activities (Indirect Method)
Cash Flow from Operations (CFO) reflects cash generated by a company’s core business operations during the period.
It begins with accrual profits and adjusts for non-cash expenses and working capital movements to reveal how much of the accounting profit actually turned into cash in hand.
Positive CFO sustained over time signals that a company’s profits are backed by real cash, whereas a consistently negative or low CFO (relative to profit) can flag issues in cash generation or aggressive revenue recognition.
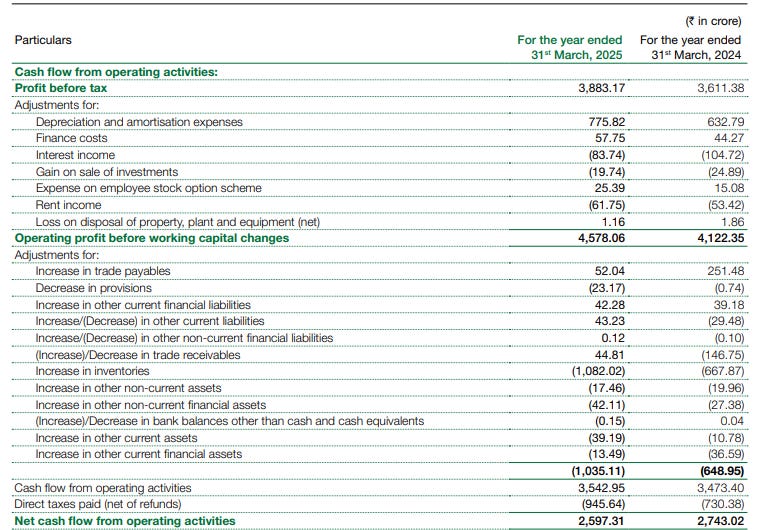
Net Profit (Starting Point)
The indirect method usually starts with net profit after tax as the base. This represents the company’s accounting earnings for the period, which are then adjusted to arrive at cash flow. Its role is to anchor CFO to the reported performance.
A key analytical check is comparing profit to CFO over multiple years, if cumulative CFO lags far behind profit, it’s a red flag that profits may be of low quality or tied up in working capital.
Manipulation of this line item occurs through earnings manipulation which we have already covered in the last post Inside the Income Statement: An Line-by-Line Forensic Breakdown.
Depreciation and Amortization ➕
Depreciation (on tangible assets) and amortization (on intangibles) are non-cash expenses deducted in arriving at profit. In the CFO statement, they are added back because no cash actually left the company for these charges during the period.
It’s crucial for understanding cash profits.
Other Non-Cash and Non-Operating Adjustments
Besides depreciation, companies adjust profit for various non-cash or non-operating items.
These may appear as separate lines for clarity: impairment losses, provisions (e.g. bad debt provisions), unrealized foreign exchange gains/losses, fair value adjustments, share-based compensation, etc. Each of these affects accounting profit but not immediate cash.
For instance, an unrealized forex loss (say on foreign currency debt) reduces profit, but since no cash has changed hands yet, it is added back to CFO. Likewise, provisions for doubtful debts or inventory write-downs are added back if they were expensed, since they don’t use cash at the time of provision.
The role of these adjustments is to strip out accounting noise and isolate actual cash earnings.
In industrial companies, inventory or receivables write-downs might be used in a year of poor profits (to “clear the decks”); those reduce profit but CFO adds them back (since the write-down is non-cash), sometimes resulting in CFO > profit in a bad year.
Investors should scrutinize notes for large non-cash entries. Usually, genuine non-cash charges like depreciation follow stable policies; volatile swings in provisions or “adjustments” warrant explanation.
Finance Costs (Interest Expense) and Investment Income
Under Ind AS, interest paid is usually classified under financing activities, and interest/dividend received under investing.
This means the CFO section in an indirect cash flow will add back interest expense (because profit was after deducting it, yet the cash outflow for interest is not included in CFO) and remove interest or dividend income (because profit included it, but the cash inflow is shown elsewhere).
Effectively, CFO (under Ind AS classification) portrays operating cash flow before interest and dividends, reflecting cash from operations regardless of how it’s financed.
However, this creates a comparison pitfall and potential for misrepresentation. By moving interest paid out of CFO, companies immediately report higher CFO than they would have under old Indian GAAP (where interest paid was an operating outflow).
Many Indian firms adopted this Ind AS change around 2016, for heavily indebted companies, CFO got a cosmetic boost simply due to reclassification of interest to financing.
Large interest expense added back in CFO should alert investors to check the financing section for large interest outflows. A company might report robust CFO but if a big chunk is being eaten up by interest payments (visible in CFF), the operating business isn’t as healthy as CFO alone suggests.
Gain or Loss on Asset Sales (Exceptional Items)
When a company sells assets or a business division, any gain or loss from the sale is reflected in the profit figure, but the cash from the sale is investing cash flow.
Under the indirect method, such gains are subtracted from profit in the CFO section (and losses are added back) to avoid double-counting cash that will appear in investing.
This line’s role is to remove nonoperating, one-time influences from CFO.
PIX Transmissions Ltd., a power transmission belts manufacturer, sold an entire business division (hoses division) in FY2013 for ₹241.85 crore. Instead of classifying the full ₹241.85 Cr as investing inflow, PIX showed only the book value of assets (~₹85.6 Cr) under investing and classified the profit portion (~₹134 Cr) as an operating inflow in CFO.
Investors should be alert to big CFO jumps coinciding with asset sales or stake disposals – the cash source may not be repeatable.
When analyzing CFO, it can be prudent to remove gains on sale (adding them back to profit if not already removed) and see what core CFO looks like. Conversely, if a loss on sale depressed profit, add it back to see underlying CFO.
The key is to ensure only genuine operating cash remains in the CFO figure.
Trade Receivables (Accounts Receivable)
This represents credit sales that haven’t been collected in cash. If receivables increase significantly, it means the company’s sales are not turning into cash quickly, perhaps due to lenient credit terms or slow collections , which drags down CFO.
Rapid sales growth accompanied by ballooning receivables can indicate aggressive revenue recognition or channel-stuffing (pushing products to distributors who haven’t paid yet.
When receivables on the balance sheet go up, it means a company has sold more on credit, i.e., it earned revenue but hasn’t yet received the cash for instance if receivables go from ₹10 Cr to ₹15 Cr, then ₹5 Cr is deducted.
Inventories
Inventory represents goods produced or purchased that are yet to be sold.
An increase in inventory signifies the company spent cash to build up stock (cash outflow, lowering CFO), whereas a decrease in inventory implies the company sold goods from stock without having to spend new cash on purchases (cash inflow, raising CFO).
Trade Payables (Accounts Payable)
Payables are amounts owed to suppliers.
If payables increase, the company has effectively borrowed from suppliers by delaying payments, which provides a cash inflow (it kept the cash instead of paying it out).
If payables decrease, it means the company paid off more bills than new credit incurred, resulting in a cash outflow (using cash to reduce liabilities).
A classic way to boost CFO is to stretch payables, simply pay your suppliers more slowly. Many companies do this near year-end to report higher cash on hand. However, it is not sustainable long-term: suppliers might demand stricter terms or refuse service.
Another angle is reclassifying other liabilities as “payables” within CFO. Some of the most striking Indian cases of CFO inflation involved treating debt or financing items as payables, thus increasing CFO.
Filatex India Ltd. (textile yarn maker) in FY2012 included an ₹18.7 Cr increase in “current maturity of long-term debt” (CMLTD) as part of “trade and other payables” in CFO. Essentially, a portion of long-term debt due within a year was moved into current liabilities and was counted as an operating inflow under working capital changes.
This accounting quirk made Filatex’s operating cash look better by that amount in FY2012, even though it was essentially debt.
Another case: Sreeleathers Ltd. (footwear retailer) in FY2014 misclassified a ₹11.5 Cr unsecured loan as an increase in other current liabilities, thereby showing it under operating cash flow.
This loan should have been financing cash inflow; by putting it in CFO, Sreeleathers’ operational cash generation appeared higher than reality.
Payable stretching is common in sectors under stress. Real estate developers, for example, often delay contractor payments to conserve cash.
A prominent case, DLF Ltd., had negative CFO in FY2013 but still paid dividends; it was noted that DLF’s current liabilities (including payables) kept rising, indicating reliance on creditors while operating cash was weak.
Rising payables year after year can’t go on forever, it will eventually hit a ceiling (creditor backlash or liquidity crunch). So, a spike in CFO due to payables should be treated with caution.
Other Current Assets/Liabilities
This is a catch-all for working capital changes not captured in the main receivables/inventory/payables lines.
It may include items like advances to suppliers, prepaid expenses, GST/tax credits (current assets), or deferred revenues, statutory dues payable, provisions, etc. (current liabilities). These can swing and affect CFO.
For example, a decrease in other current assets (say recovery of an advance or a prepaid expense amortizing) is a cash inflow. An increase in other liabilities (say more customer advances, or salaries payable accrued) is an inflow.
Many of the tricky items often hide here.
Many real estate developers in India during the 2010s collected large booking amounts from customers for planned projects, showing strong CFO, only to later refund or face cash issues when sales slowed.
Always differentiate one-time working capital boosts from sustainable operations.
If “other current liabilities” contributed a lot to cash flow this year, will it repeat or reverse next year? If “other current assets” shrank (boosting cash), was it from an unwinding that might not continue?
Cash Generated from Operations
After adding back non-cash items and factoring in working capital changes, we get cash generated from operations. This subtotal represents the cash the business operations produced before paying interest and taxes (and before any extraordinary items).
It’s a critical figure for understanding operating efficiency and cash conversion.
If a company’s products and services are fundamentally profitable and well-managed, this number should be consistently positive and ideally growing with profits. If it’s negative, the company is burning cash in its day-to-day activities.
The quality of cash from ops can be tested by examining its components: is it coming from healthy sources (e.g. profit plus modest working capital management), or from big one-offs?
Several of our examples (India Glycols, Filatex) had extremely high cash from ops in a single year due to those one-time classification tricks.
Investors who naively looked at the CFO trend might have thought the companies turned into cash spigots, but a careful line-by-line read revealed the true source.
Income Taxes Paid
This line shows the actual cash taxes paid to the government during the period (net of any refunds). It is subtracted from “cash generated from operations” to arrive at net operating cash flow. Its role is straightforward, taxes are an operating cash outflow that every profit-making company must eventually pay.
Comparing “tax paid” to the tax expense on the income statement can be insightful: if cash taxes are significantly lower than accrued tax expense, the company might be deferring taxes (via credits, timing differences) or perhaps not paying due taxes on time.
Consistently paying much less cash tax than the P&L expense might temporarily boost CFO, but could reverse in future (when those deferrals come due).
Net Cash from Operating Activities (CFO)
After adjusting for taxes (and interest if the company, contrary to Ind AS norm, included interest in CFO, but most don’t under Ind AS), we get the net cash flow from operating activities.
This tells us whether the company’s core operations are self-funding. Positive CFO means the firm generated more cash than it spent in running its business (before capex and financing). Negative CFO means it had to draw on cash from other sources (like bank loans or equity or asset sales) just to fund operations.
As a rule of thumb, over the long run, a company’s CFO must be positive and ideally cover its investing needs; otherwise it’s relying on external funding just to survive.
A strong CFO, especially when consistently close to or above net profit, is a hallmark of high earnings quality
Real-world perspective: Many Indian companies have had instances of “CFO spikes.” A classic example is telecom companies during spectrum auctions: they often received large customer deposits (e.g. for tower leasing or long-term contracts) upfront, temporarily juicing CFO, even as their actual profit might be under pressure.
Retail investors should be particularly careful when a company touts its “operating cash flow doubled this year”, dig into why. If it’s because they simply collected a previously unpaid bill or sold an asset, that’s not from ongoing operations.
Ideally, net CFO should come from earnings growth and efficient working capital management, not accounting maneuvers.
Cash Flows from Investing Activities
Cash Flow from Investing (CFI) captures cash used in or generated from long-term investments, purchase or sale of assets, investments in subsidiaries or financial instruments, etc.
This section is crucial for understanding a company’s growth and capital allocation strategy.

Capital Expenditure (Purchase of Property, Plant & Equipment and Intangibles) (➖)
This line shows cash outflows for acquiring long-term assets – factories, machinery, technology, R&D capitalization, etc.
Capex is necessary for growth and maintaining operations. Healthy companies tend to reinvest a portion of their operating cash into new assets.
If capex is consistently much higher than CFO, the company either needs external funding or is investing ahead of current cash generation (which could be fine if returns are high later, or worrisome if investments aren’t yielding results).
It’s harder to fake capex, as it usually involves actual cash payments. However, companies can mis-categorize certain expenditures as capex.
This is essentially the flip side of the operating expense capitalization we discussed: if a firm inappropriately capitalizes something that should be an operating expense, it will show up as higher “purchase of assets” here instead of reducing CFO.
That manipulation makes CFO higher and capex higher. The net effect on total cash (CFO + CFI) might be zero, but the allocation is skewed. This can mislead FCF analysis, a casual observer might see a positive CFO and think operations are fine, while the negative CFI (capex) might be ignored as “growth investment” whereas some of it was actually operating cost.
Capex line should be scrutinized, if it’s low, is the company under-investing (which could harm future prospects)? If it’s very high, is it productive investment or capitalizing everything including the kitchen sink?
Always Check the notes to see the breakdown.
Proceeds from Sale of Property, Plant & Equipment (➕)
This is the cash inflow from disposing of fixed assets. It’s usually minor for ongoing businesses (sale of old equipment, etc.), unless there’s a strategic sale.
Frequent reliance on asset sales for cash is a red flag, it may signal distress (the company is selling the family gold to pay the bills).
Another thing to watch: sale and leaseback transactions. If a company sells an asset and leases it back, Ind AS will determine how that’s accounted (often as a sale if control transfers). The cash inflow will appear here as sale of PPE, boosting investing cash.
The lease payments will hit CFO (if operating lease) or financing (if finance lease payments). Sometimes companies do sale-leasebacks to improve short-term cash position, which will show a one-time inflow in CFI. It can be a legitimate financing strategy, but essentially it’s borrowing against the asset.
Several Indian airlines and retail chains have used sale-leaseback of real estate or aircraft to raise cash. As an investor, recognize that as a non-recurring cash inflow, adjust your free cash flow analysis accordingly (treat it more like financing).
Purchase/Sale of Investments (Financial Investments) (➕)
Companies often invest surplus cash in financial instruments (mutual funds, bonds, bank deposits) or in other companies (equity stakes, joint ventures). Cash spent on such investments is an outflow; cash received from selling or redeeming investments is an inflow.
These lines show treasury management and strategic investments. For example, a cash-rich IT firm might park money in mutual funds, when it increases those investments, CFI goes negative; if it redeems funds, CFI gets a positive bump.
NBFCs (non-bank financiers) and holding companies have large investment line items, which is expected for their business. But in manufacturing companies, big swings in “purchase of investments” often correspond to parking excess cash or liquidating it.
Acquisition or Sale of Subsidiaries/Businesses
If the company acquired another company or business segment for cash, it will record an investing outflow (often net of any cash acquired). Likewise, cash proceeds from selling a subsidiary or business line are investing inflows.
Dividends Received (➕)
Cash dividends from investments in other companies (or joint ventures, associates) are investing inflows under Ind AS.
For a standalone statement, this often includes dividends from subsidiaries. Role: For many holding companies, this is a key source of cash.
For example, Coal India (a holding company for coal-producing subsidiaries) receives dividends from its subcompanies, which appear as standalone investing inflows.
On a consolidated basis, those internal dividends are eliminated (since it’s just moving cash within the group). Thus, large dividends received can cause a big difference between standalone and consolidated cash flows.
Example: Vedanta Ltd., a mining conglomerate, gets huge dividends from Hindustan Zinc Ltd (HZL) (of which it owns ~65%). These dividends (running into thousands of crores) show up as cash inflows in Vedanta’s standalone investing cash flow, enabling Vedanta to, in turn, pay dividends to its shareholders and service debt.
However, on a consolidated level, HZL’s dividend to Vedanta is an internal transfer and does not appear in group CFI (instead, the group’s CFO includes HZL’s operating cash that enabled those dividends). This scenario has raised governance questions: short-seller’s reports allege Vedanta’s parent siphons cash via high dividends from HZL, sometimes beyond HZL’s own free cash flow.
Always check if dividends received came from genuine profits of the investee or if the investee’s own cash flows are suspect (in HZL’s case, concerns were that high dividends were forcing it to lever up or cut capex).
Interest Received (➕)
Interest on loans, deposits, or bonds held by the company is another investing inflow under Ind AS (for non-financial firms). It shows return on financial assets.
For companies with large cash reserves or lender companies, this can be significant. E.g., debt-free IT companies often earn interest on bank deposits, a non-trivial source of cash.
Net Cash from Investing Activities
This is the sum of all investing inflows and outflows.
Negative net CFI (i.e. cash used in investing) is very common for growth companies, it indicates they are investing their operating cash (and maybe some borrowed funds) into future growth.
If net CFI is positive (cash inflow) consistently, it may mean the company is divesting assets or scaling back investment, possibly a sign of a mature or shrinking business.
Summing up investing cash flows: Investigate large acquisitions or disposals (one-offs), and be wary if positive investing cash flow is covering a shortfall in CFO (it could mean the company is selling assets to keep afloat).
Ensure that if management is touting “free cash flow”, they’re not doing so by slashing needed investments or by quietly classifying expenses as assets. In the long run, a company that consistently needs much more cash for investing than it generates from operations will rely on financing, which is our next section.
Cash Flows from Financing Activities
Cash Flow from Financing (CFF) records transactions that fund the company or return capital to providers of funds. This includes equity issuance or buybacks, debt borrowings and repayments, dividends, and interest paid.

Proceeds from Issuance of Share Capital (Equity)
When a company issues new shares, whether via a public offering, private placement, rights issue, or exercise of employee stock options, the cash inflow appears here.
For young or growing companies, periodic equity raises might be normal (e.g., startups, banks meeting capital norms). For established companies, a fresh equity issue might signal expansion (if for a project) or distress (if needed to plug losses or high debt).
Proceeds from Borrowings (Debt Raised)
This includes cash inflows from new loans, bonds, or other borrowings. Often split into short-term and long-term in notes.
Rising debt inflows year after year may indicate the company relies on borrowing to fund operations or growth. Healthy companies might still take loans for capex but ideally have CFO to service them.
Forensic clue: if you see debt on the balance sheet increased but the cash flow from financing doesn’t fully reflect a similar borrowing inflow, investigate where the cash came in.
For example, Filatex’s balance sheet debt rose by ₹18.7 Cr more than the financing section showed, that gap was the CMLTD they put in CFO.
Under Ind AS, lease liabilities (from operating leases capitalized), the principal portion of lease payments is a financing outflow, but the inception of a new lease (bringing an asset and a lease liability on books) is a non-cash financing transaction.
Repayment of Borrowings
Cash outflows for repaying loans or redeeming bonds are recorded here.
Significant debt repayments indicate deleveraging, which can be positive if done from internal cash. Sometimes companies refinance instead (i.e., new debt in, old debt out, which net might not show big change in cash flows).
Interest Paid
Under Ind AS, interest paid on borrowings is typically shown as a financing cash outflow.
The classification is standard now, but historically, interest paid was CFO in Indian GAAP. If a firm wanted to inflate CFO, shifting interest to financing (as Ind AS allows) did the trick legitimately. All Ind AS adopters got this benefit around 2016.
Always correlate interest outflow with CFO: a healthy firm should earn comfortably more cash from ops than its interest obligations, otherwise debt might be unsustainable.
Dividends Paid
Cash outflows for dividends to shareholders are financing uses of cash. This includes both equity dividends and any dividends paid to minority interests in subs (in consolidated statements).
Steady or growing dividends often signal confidence and shareholder-friendly management, but they require underlying cash generation.
A critical issue is when companies fund dividends through debt rather than through genuine free cash flow. The combination tells a story, since one line will show dividend outflow and another will show debt inflow.
A study by India Ratings found 57 large Indian firms borrowed over ₹19,000 Cr in FY2013 to pay dividends, with even more the next year.
Highly leveraged companies like DLF (real estate) and L&T (engineering) maintained or even increased dividends despite negative operating cash flows, effectively using debt to “look after shareholders”.
DLF’s net debt and leverage rose significantly in that period as it kept a ₹2/share dividend even when earnings and CFO fell.
This practice props up investor sentiment in the short term but weakens the balance sheet. Forensically, one should examine the ratio of dividends paid to CFO. If over several years a company’s dividends exceed its cumulative free cash flow, it’s funding payouts via external means (debt or asset sales).
While not an accounting trick, it’s a financial strategy that can mask operational weakness. Management might not explicitly state “we borrowed to pay dividends,” but the cash flow pattern reveals it.
Other Financing Activities
This includes share buybacks, cash out to buy back shares (reverse of issuance), which reduces cash and equity. It may also include finance lease payments (principal portion, since under Ind AS 116 lease principal repayments are financing outflows, akin to debt repayment). Sometimes, security deposits taken or repaid might be here if deemed financing in nature.
Also, any cash related to derivatives or hedging of financing might appear.
Net Cash from Financing Activities
This is the net result of all financing inflows and outflows. A positive number means the company raised cash via financing (increasing debt or equity net), while a negative means it was a net user of cash for financing (paying down debt, buying back shares, or paying dividends more than new financing.
Growing companies or those in need usually have positive net CFF (bringing in cash), whereas mature cash-generative companies often have negative net CFF (they use excess cash to pay dividends, repurchase stock, or pay debt down). Neither is inherently bad, context matters.
If net CFF is persistently positive (debt climbing) while CFO is persistently negative or weak, the company is living on financing, unsustainable unless a turnaround comes. If net CFF suddenly flips because external funding dries up, the company could face a cash crunch.
The financing section is often where distress shows up last: a company with poor CFO will patch the hole with financing until it can’t. E.g., Jet Airways kept borrowing and leasing planes (financing inflows) to compensate for operational losses (negative CFO) until lenders finally cut it off, leading to collapse.
One more item to mention in cash flow statements, often shown after the three sections:
Effect of Exchange Rate Changes on Cash: For companies with foreign operations, Ind AS cash flow statements separately show the impact of currency fluctuations on cash and cash equivalents held (since the statement is in domestic currency).
After the three sections, the statement will show Net Increase/Decrease in Cash & Equivalents, then Opening Cash Balance and Closing Cash Balance (reconciled with balance sheet cash). It’s good practice to see if the closing cash makes sense relative to needs.
Wrapping Up: Trust the Cash, Not the Gloss
At the end of the day, what flows in and out of a company’s bank account matters far more than what’s dressed up for the earnings parade. Understanding cash flow from operations, warts and all, is your best bet in separating the solid businesses from the ones just pretending to be.
The indirect method may feel like deciphering a puzzle at first, but it’s worth every moment spent unraveling it. After all, if you’re going to entrust your hard-earned money to a company, wouldn’t you like to know if it’s thriving on genuine strength or just puffed-up accounting?
It’s no exaggeration to say that cash flow analysis could save you from a few regrettable decisions, and sleepless nights. Like Charlie Munger might remind us, “The iron rule of money is that it has to come in before it can go out.” The same applies to any business worth your investment.
Now, it’s your turn. Sharpen your pencils, open those reports, and start peeling back the layers. And remember, a bit of skepticism has never harmed a smart investor. Keep asking the right questions, it’s how you find the right answers. What better way to protect your portfolio than to ensure it's built on cash-backed reality rather than rosy hopes?
🧾 That’s the full breakdown. If you’ve stuck with me through all 4 parts, thank you.
I hope these posts helped you see financials a little differently, and a little more clearly.
If you’d like to support more independent, in-depth work like this, you can contribute any amount here:
👉 Support my writing
Every bit helps keep this blog free, ad-free, and focused on deep research.
This is like an essential read for every value investor who is separating wheat from the chaff.
Couple of good mental models for quantitative screening can be applied to shortlist Solid Businesses
For the last 5 years; cumulatively
Dividend paid < CFO - companies paying debt from their own cash & not borrowed
CFI > 0 - mature companies
CFI< 0 - growing companies
CFO > CFF or some ratio - cash generating companies
CFO / PAT > 70% - real cash profit and not only accounting profits
Also it would be great to build up the cash flow statement via indirect method yourself to separate out bad accounting practices - worth the effort
It is really well structured and insightful piece-Can’t wait to read more from you!
To sumps it up perfectly- “profits is the vanity and cash flow is the sanity”